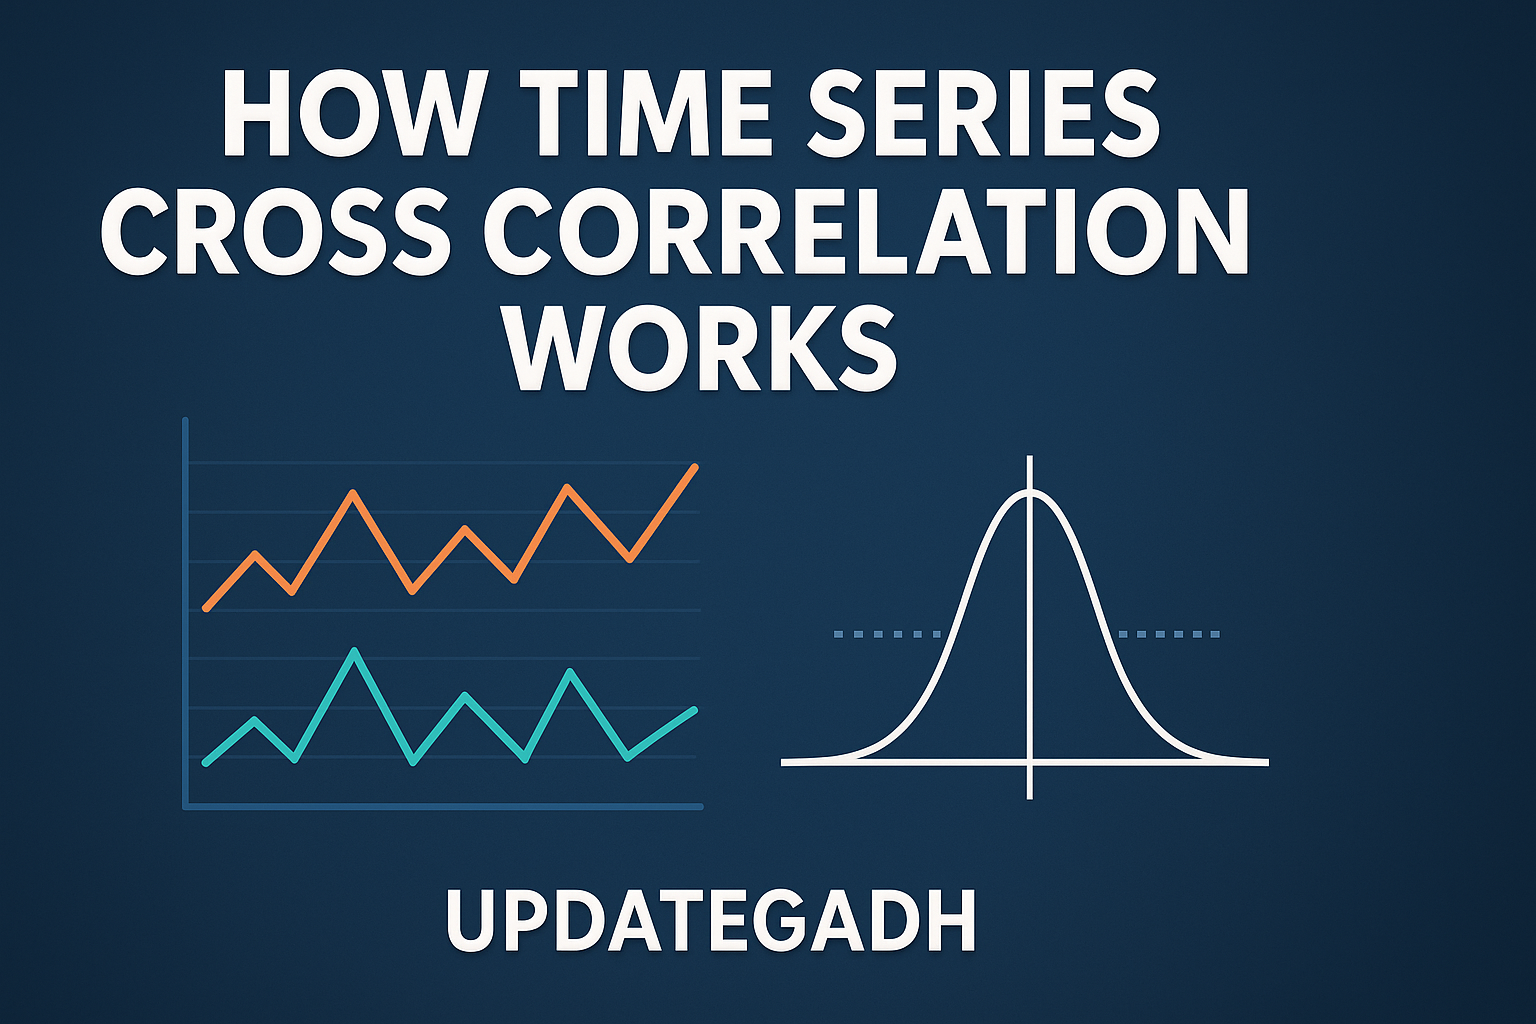
How Time Series Cross Correlation Works
How Time Series Cross Correlation Works
Introduction
Time series cross-correlation is a statistical technique used to assess the relationship between two time-dependent variables across different time lags. Unlike standard correlation, which measures the direction and strength of a relationship at the same point in time, cross-correlation considers how one dataset influences or aligns with another over a span of time.
This method is particularly valuable when studying datasets where delayed responses are expected. For example:
- In finance, stock prices of two companies may respond to market forces with a time lag.
- In meteorology, temperature changes may affect weather patterns days later.
At its core, cross-correlation involves shifting one time series relative to another and computing the correlation at each lag. Peaks in the cross-correlation function (CCF) reveal where one variable leads or lags behind the other. A positive lag indicates the first series precedes the second, while a negative lag suggests the opposite.
Cross-correlation is widely used in signal processing, economics, neuroscience, and climate studies. However, it must be applied carefully, as seasonality or non-stationarity in data can produce misleading results. Preprocessing steps like detrending and normalization are often required to extract meaningful insights.
Machine Learning Tutorial:-Click Here
Data Science Tutorial:–Click Here
Complete Advance AI topics:-CLICK HERE
DBMS Tutorial:-CLICK HERE
Understanding Cross-Correlation
Cross-correlation measures how similar two time series are when one is shifted relative to the other. Unlike basic correlation, which only captures relationships at matching time points, cross-correlation accounts for temporal dependencies.
Key insights:
- Positive lag: The first series leads the second.
- Negative lag: The second series leads the first.
- Zero lag: Both series move together at the same time.
This makes cross-correlation an essential tool in domains where events unfold with delays—such as signal transmission, economic forecasting, and meteorological modeling.
Cross-Correlation vs. Correlation
Correlation:
- Measures the strength and direction of a linear relationship between two variables at the same moment.
- Represented by Pearson’s coefficient (ranging from -1 to +1).
- Commonly used in finance, regression analysis, and social sciences.
Cross-Correlation:
- Goes beyond correlation by analyzing the relationship across different time lags.
- Produces a function (CCF) instead of a single coefficient.
- Helps identify whether one variable leads or lags another.
- Widely used in economics, weather studies, and signal processing.
How to Calculate Cross-Correlation
- Prepare the Data
- Ensure consistent time intervals and handle missing values.
- Use interpolation or resampling if necessary.
- Normalize the Series (Optional but Recommended)
- Standardize both series to have zero mean and similar scales.
- Prevents skewed results due to differing magnitudes.
- Compute the Cross-Correlation Function (CCF)
- Shift one series relative to the other across multiple lags.
- Calculate correlation coefficients at each lag.
- Identify the Strongest Correlation
- The lag with the highest absolute correlation indicates the leading/lagging relationship.
- Interpret Results Carefully
- Seasonality and external factors may distort correlations.
- Use confidence intervals or statistical tests to validate findings.
- Use Tools for Computation
- Python, R, MATLAB, or Excel can simplify the process.
- Visualization (like CCF plots) makes interpretation easier.
Applications of Cross-Correlation
1. Economics and Finance
- Detects lead-lag relationships between stock prices, exchange rates, or economic indicators.
- Supports risk management and investment decision-making.
2. Signal Processing and Communication
- Identifies time delays and recurring patterns in signals.
- Used in radar, sonar, and wireless communication for synchronization.
3. Weather and Climate Studies
- Examines dependencies between meteorological variables such as temperature and pressure.
- Helps in predicting weather trends and climate impacts.
4. Medicine and Neuroscience
- Analyzes brain region interactions through neural signals.
- Studies treatment effects on physiological indicators like heart rate or blood pressure.
5. Manufacturing and Quality Control
- Detects system anomalies by comparing sensor data over time.
- Enhances production process monitoring.
6. Social Media and Network Analysis
- Tracks how trends, hashtags, or conversations spread across platforms.
- Informs digital marketing strategies.
7. Earth Science and Seismology
- Detects seismic wave patterns and earthquake propagation.
- Assists in locating earthquake sources.
Limitations and Challenges
- Non-Stationary Data: Time series must have stable statistical properties; detrending and differencing are often required.
- Spurious Correlations: Strong cross-correlation doesn’t always imply causation—hidden factors may drive results.
- Outliers and Noise: Extreme values can distort correlation estimates.
- Lag Range Selection: Choosing an inappropriate lag window may miss critical patterns.
- Large Datasets: High-frequency or large-scale data can make computation resource-intensive.
- Seasonality Effects: Periodic cycles can mimic correlations if not accounted for.
- Complex Systems: Multivariate systems may require advanced methods like Granger causality or transfer entropy.
Tools and Libraries for Cross-Correlation
- Python: NumPy (
correlate), SciPy (signal.correlate), Pandas, Statsmodels. - MATLAB:
xcorr()function with built-in visualization. - R: TSA, Forecast, and Tidyverse packages for time series modeling.
- Excel: Data Analysis ToolPak for simple exploratory correlations.
- Julia:
TimeSeries.jl,StatsBase.jl, andDSP.jlfor efficient computation. - GNU Octave & Scilab: Open-source MATLAB alternatives.
- Specialized Software: SPSS, Stata, and EViews for domain-specific modeling.
Complete Python Course with Advance topics:-Click Here
SQL Tutorial :–Click Here
Download New Real Time Projects :–Click here
Conclusion
Time series cross-correlation is a powerful statistical method that uncovers delayed relationships between datasets. From financial markets to climate studies and neuroscience, it offers valuable insights into how variables evolve over time.
However, results must be interpreted cautiously—non-stationarity, noise, and hidden influences can lead to misleading conclusions. Proper preprocessing, careful lag selection, and complementary statistical tests are essential to ensure reliable outcomes.
For analysts, researchers, and professionals, cross-correlation remains a cornerstone technique for exploring dynamic, time-dependent systems.
cross correlation time series python
correlation between two time series python
cross correlation python
time series correlation between two variables
time series correlation matlab
cross correlation function
time series correlation r
cross correlation formula
how time series cross correlation works in r



Post Comment