Understanding the Moving Average (MA) in Time Series Data
Moving Average (MA) in Time Series Data
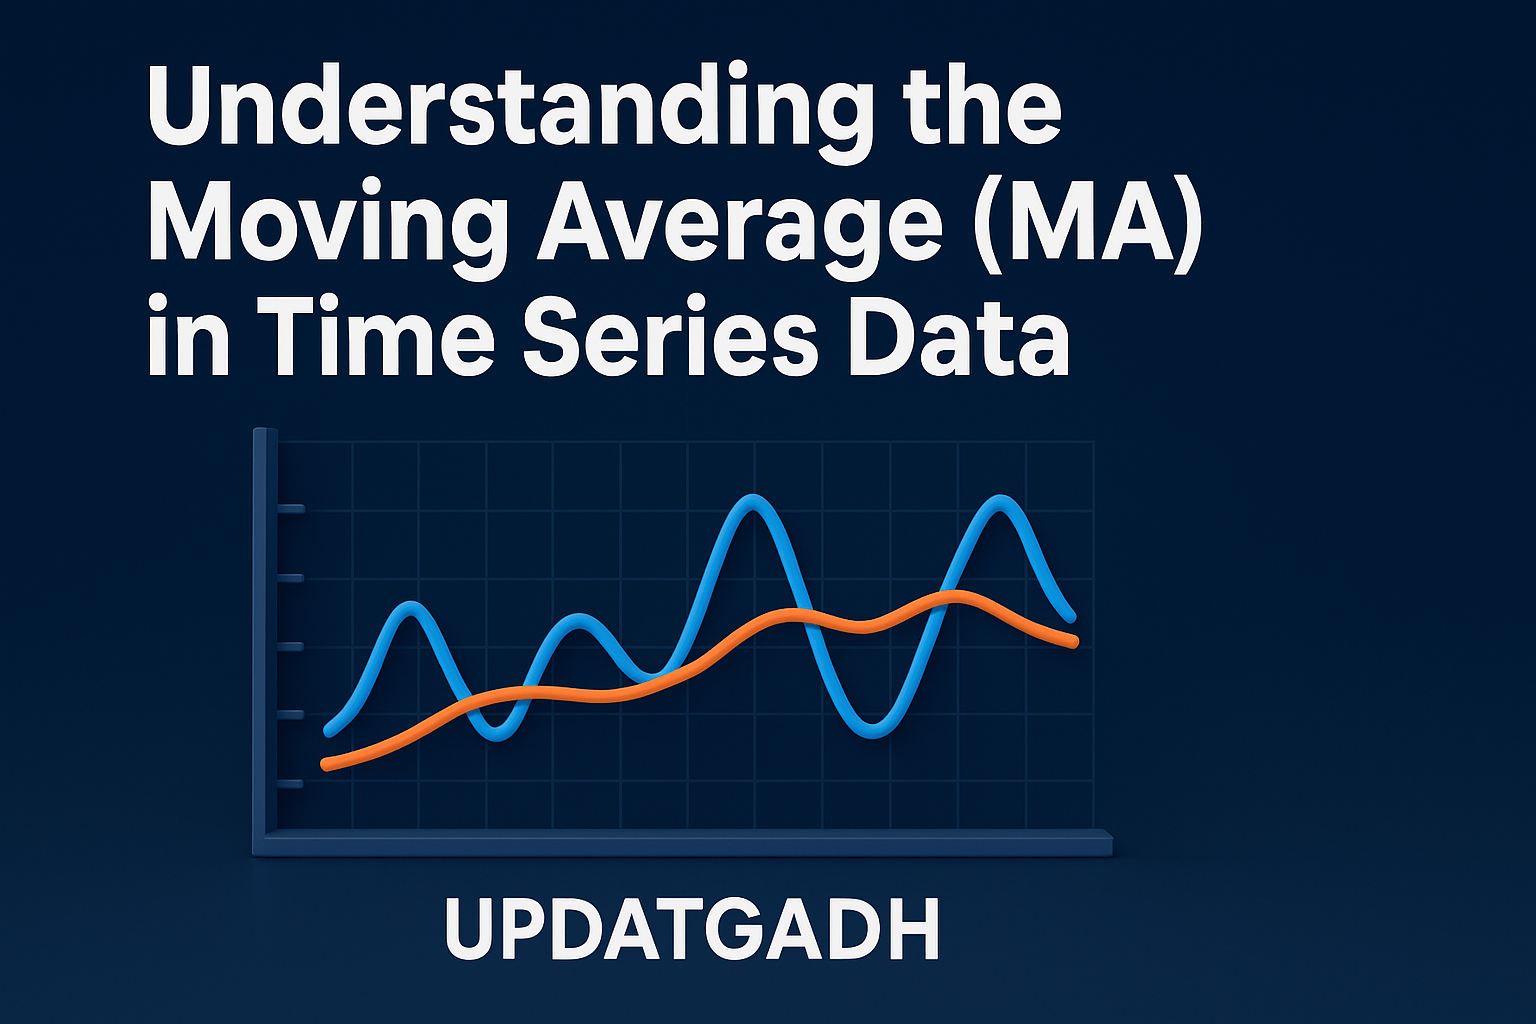
The Moving Average (MA) is one of the most widely used statistical methods in time series analysis.It draws attention to long-term cycles or patterns while mitigating short-term swings. Because of its simplicity and effectiveness, it has become a core tool for forecasting and analyzing data trends across multiple fields such as finance, economics, engineering, and data science.
What is a Moving Average?
A Moving Average (MA) is a statistical technique that calculates the average of a specific number of past data points, updating continuously as new data becomes available. The term “moving” refers to the shifting nature of the calculation—each new observation is added while the oldest one is dropped from the calculation window.
This simple mechanism reduces noise and makes patterns more visible in the data, enabling analysts to focus on meaningful insights rather than random fluctuations.
Machine Learning Tutorial:-Click Here
Data Science Tutorial:–Click Here
Complete Advance AI topics:-CLICK HERE
DBMS Tutorial:-CLICK HERE
Example of a Simple Moving Average (SMA)
The simplest type of moving average is called a Simple Moving Average (SMA). Every data point inside the selected window size is given the same weight.
Example:
Suppose we have stock closing prices for seven days:10, 12, 14, 16, 18, 20, 22
If we calculate a 3-day SMA:
- First SMA = (10 + 12 + 14) / 3 = 12
- Second SMA = (12 + 14 + 16) / 3 = 14
- Third SMA = (14 + 16 + 18) / 3 = 16
- Fourth SMA = (16 + 18 + 20) / 3 = 18
- Fifth SMA = (18 + 20 + 22) / 3 = 20
The SMA values for the last five days are: 12, 14, 16, 18, 20.
This technique is often used in stock market analysis to make short-term fluctuations less distracting, thereby highlighting the overall direction of movement.
Types of Moving Averages
There are multiple variations of moving averages, each designed to balance responsiveness and smoothness differently:
- Simple Moving Average (SMA) – All data points are given equal weight, which is beneficial for long-term trends.
- Exponential Moving Average (EMA) –More responsive to abrupt changes; gives more weight to recent data.
- Weighted Moving Average (WMA) – Allows custom weighting of data points; useful when certain observations are more significant.
- Cumulative Moving Average (CMA) – takes into account all available data and keeps updating.
- Triangular Moving Average (TMA) –uses double smoothing to further minimise volatility.
Each type serves different analytical needs, from financial trading to climate research.
Uses of Moving Averages
1. Financial Market Analysis
Traders rely heavily on SMA and EMA to identify market trends, generate buy/sell signals, and interpret price movements. Crossovers—such as the Golden Cross (bullish signal) and Death Cross (bearish signal)—are classic strategies based on moving averages.
2. Demand Forecasting & Inventory Management
Companies analyze historical sales using moving averages to forecast demand and optimize inventory, reducing the risks of overstocking or shortages.
3. Weather & Climate Studies
Meteorologists apply moving averages to track long-term temperature or rainfall trends by filtering out daily variations.
4. Signal Processing
Engineers use moving averages to eliminate noise in applications such as image processing, speech recognition, and monitoring systems.
5. Economic & Business Analysis
Economists study GDP growth, inflation, and spending patterns through moving averages to make policy and business recommendations.
Some Related Concepts
Moving Averages in Machine Learning
In machine learning, moving averages are applied during feature engineering to smooth raw data, remove noise, and improve forecasting accuracy. Models like LSTMs, Random Forests, and XGBoost often use SMA or EMA as input features.
They are also valuable in anomaly detection, fraud prevention, and predictive maintenance by flagging unusual deviations in data patterns.
Trend Analysis
Trends can be upward (bullish), downward (bearish), or sideways (neutral). Moving averages highlight these movements clearly.
For instance:
- A rising MA indicates an uptrend.
- A falling MA signals a downtrend.
- A trend reversal is frequently indicated by a crossover between a short-term and long-term MA.
This technique is widely used not only in finance but also in economics and weather studies.
Crossovers & Trading Strategies
Crossovers are essential for traders:
- Golden Cross:A short-term MA (such as the 50-day SMA) surpassing a long-term MA (such as the 200-day SMA). suggests a possible upward trend.
- Death Cross: crossover of the short-term MA below the long-term MA. signals a period of bearishness.
Traders may also use dual or triple MA strategies to refine entry and exit points.
Moving Average Convergence Divergence (MACD)
The MACD is a popular technical indicator that combines EMAs to measure momentum.
- MACD Line = 12-day EMA – 26-day EMA
- Signal Line = 9-day EMA of the MACD Line
- Histogram = Difference between MACD Line and Signal Line
Interpretation:
- MACD above the signal line → bullish signal
- MACD below the signal line → bearish signal
- Divergence between MACD and price → potential trend reversal
Smoothing Techniques
The most used smoothing technique is moving averages, although there are other options as well:
- SMA – Equal weighting.
- EMA – Higher weight for recent data.
- WMA – Custom weight distribution.
- Holt-Winters Smoothing – Useful for seasonal and trend-based data.
- Loess (Local Regression) – Fits non-linear patterns locally.
- Savitzky-Golay Filter – Preserves important features while removing noise.
The choice of method depends on the type of data and sensitivity needed.
Complete Python Course with Advance topics:-Click Here
SQL Tutorial :–Click Here
Download New Real Time Projects :–Click here
Final Thoughts
Moving averages are a foundational tool in time series analysis, offering clarity by filtering out noise and revealing trends. From stock trading and economics to climate research and machine learning, they are indispensable for decision-making and forecasting.
Understanding the different types of moving averages, their applications, and related techniques allows analysts and businesses to make data-driven strategies with greater accuracy.
For more professional guides on data science, statistics, and forecasting, visit Updategadh.
moving average method in time series pdf
moving average formula
moving average time series example
moving average method in time series questions
moving average method example
moving average indicator settings
seasonal variation in time series formula
moving average forecasting



Post Comment