Your cart is currently empty!
K-Means Clustering Algorithm
Menu
K-Means Clustering Algorithm
🧠 What is K-Means Clustering?
In data science and machine learning, K-Means Clustering is a potent unsupervised learning technique that groups unlabelled data into meaningful clusters. It’s a go-to method when you want to discover patterns in your data without having prior labels.
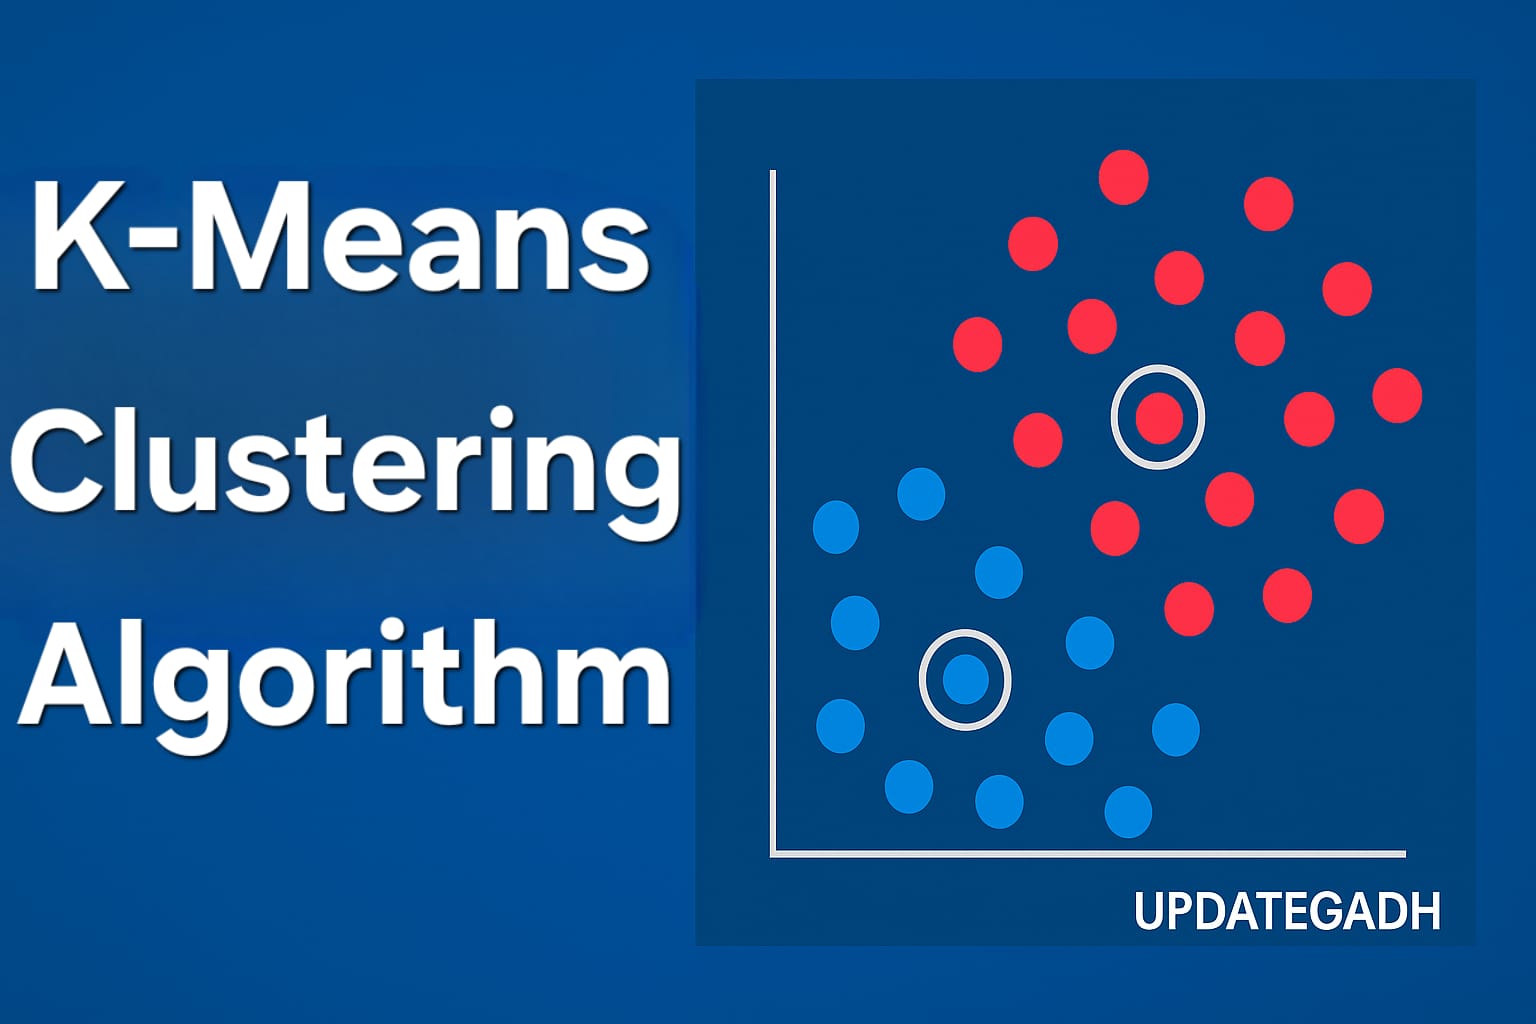
At its core, the algorithm aims to partition data into K clusters, where each data point belongs to the cluster with the nearest centroid, helping to uncover hidden groupings in data.
Example: If K=3, the algorithm creates three clusters and assigns each data point to one of these clusters based on similarity.
Complete Python Course with Advance topics:-Click Here
SQL Tutorial :-Click Here
🛠️ How Does the K-Means Algorithm Work?
K-Means is an iterative algorithm, and its process can be broken down into the following steps:
- Choose K (number of clusters).
- Initialize K centroids randomly (can be points in or outside the dataset).
- Each point should be assigned to the closest centroid.
- Determine the mean of the points in each cluster to recalculate the centroids.
- Repeat steps 3 and 4 until the centroids stop changing (convergence).
📍Goal: Minimize the sum of squared distances between points and their corresponding cluster centroids.
🎯 Visualizing the Steps
Let’s say we have two variables M1 and M2 plotted on a scatter plot. If we set K=2, we randomly choose two centroids and assign points based on their proximity. We then:
- Calculate new centroids for each cluster.
- Reassign data points.
- Repeat until no further changes occur.
Eventually, we get well-separated clusters where intra-cluster similarities are high and inter-cluster differences are clear.
❓How to Choose the Right Value of K?
It’s crucial to select the appropriate number of clusters (K). One of the most popular techniques to determine the optimal value of K is:
🔍 Elbow Method
The Elbow Method involves:
- Running K-Means for K = 1 to 10.
- Calculating WCSS (Within-Cluster Sum of Squares) for each K.
- Plotting the WCSS values against K.
- locating the “elbow”—the point at where the curvature bends abruptly.
📉 That “elbow” point gives us the optimal K.
WCSS Formula:
WCSS = Σ (distance of each point from its cluster centroid)²
🐍 Python Implementation of K-Means Clustering
Let’s walk through a practical implementation using Python. We’ll use the Mall Customers dataset, which includes customer data like age, income, and spending score.
📦 Step 1: Data Preprocessing
# Importing necessary libraries
import numpy as np
import matplotlib.pyplot as plt
import pandas as pd

# Loading the dataset
dataset = pd.read_csv('Mall_Customers_data.csv')

# Selecting features (Annual Income and Spending Score)
x = dataset.iloc[:, [3, 4]].values
📈 Step 2: Finding Optimal K using Elbow Method
from sklearn.cluster import KMeans

wcss = []
for i in range(1, 11):
    kmeans = KMeans(n_clusters=i, init='k-means++', random_state=42)
    kmeans.fit(x)
    wcss.append(kmeans.inertia_)

# Plotting the results
plt.plot(range(1, 11), wcss)
plt.title('The Elbow Method')
plt.xlabel('Number of clusters')
plt.ylabel('WCSS')
plt.show()
You can clearly identify your ideal K, or the “elbow” point, on the graph.
🚀 Step 3: Applying K-Means to the Dataset
# Let's say the optimal K is 5
kmeans = KMeans(n_clusters=5, init='k-means++', random_state=42)
y_kmeans = kmeans.fit_predict(x)
🎨 Step 4: Visualizing the Clusters
# Visualizing the clusters
plt.scatter(x[y_kmeans == 0, 0], x[y_kmeans == 0, 1], s=100, c='red', label='Cluster 1')
plt.scatter(x[y_kmeans == 1, 0], x[y_kmeans == 1, 1], s=100, c='blue', label='Cluster 2')
plt.scatter(x[y_kmeans == 2, 0], x[y_kmeans == 2, 1], s=100, c='green', label='Cluster 3')
plt.scatter(x[y_kmeans == 3, 0], x[y_kmeans == 3, 1], s=100, c='cyan', label='Cluster 4')
plt.scatter(x[y_kmeans == 4, 0], x[y_kmeans == 4, 1], s=100, c='magenta', label='Cluster 5')

# Plotting centroids
plt.scatter(kmeans.cluster_centers_[:, 0], kmeans.cluster_centers_[:, 1],
            s=300, c='yellow', label='Centroids')

plt.title('Clusters of mall customers')
plt.xlabel('Annual Income (k$)')
plt.ylabel('Spending Score (1–100)')
plt.legend()
plt.show()
🧠 Summary
- A straightforward yet effective clustering approach is K-Means.
- Works well when groups in the data are distinct and well-separated.
- Scales well to large datasets.
- To determine the ideal number of clusters, apply techniques such as the Elbow Method.
- K-Means assumes clusters are spherical and evenly sized, so it may not perform well on more complex shapes or distributions.
Download New Real Time Projects :-Click here
Complete Advance AI topics:- CLICK HERE
🧩 Final Thoughts
K-Means Clustering is one of the first tools data scientists reach for when uncovering patterns in unlabeled data. Whether it’s customer segmentation, image compression, or market research, K-Means offers a clean and efficient way to group similar items and gain insights.
k-means clustering example
k-means clustering algorithm in machine learning
k-means clustering solved example
k-means clustering algorithm python
k-means clustering algorithm in data mining
k-means clustering algorithm numerical example
k-means clustering formula
k-medoids clustering
Post Views: 68
clustering clustering algorithms clustering in machine learning k means algorithm k means algorithm in machine learning k means clustering k means clustering algorithm k means clustering example k means clustering in machine learning k means clustering python k-means clustering k-means clustering algorithm k-means clustering example k-means clustering tutorial kmeans algorithm in machine learning what is k-means clustering
Leave a Reply